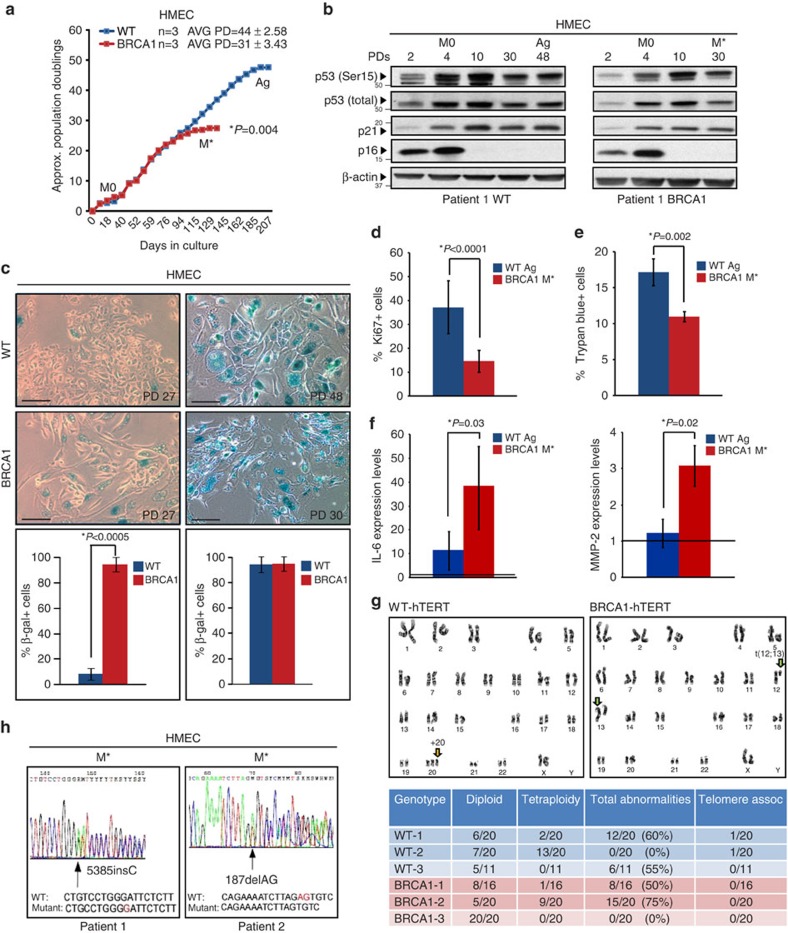
Figure 2. BRCA1mut/+ HMECs undergo premature senescence.
(a) Representative growth curves of WT (n=3) and BRCA1mut/+(n=3) HMECs. (b) Western blot analysis of p16INK4a, total p53, p53 (Ser15) and p21 levels in WT and BRCA1mut/+ HMECs at indicated PDs. M0, stasis, Ag, agonescence (WT HMECs), M*, premature growth arrest (BRCA1mut/+ HMECs). (c) Brightfield images of SA-β-galactosidase staining and quantification of positive cells at selected PDs in WT and BRCA1mut/+ HMECs. (d) Percent of Ki-67-positive cells by IF staining in cultures of Ag WT and M* BRCA1mut/+ HMECs. (e) Percent of Trypan blue-positive cells in cultures of Ag WT and M* BRCA1mut/+ HMECs. (f) mRNA levels of IL-6 and MMP-2 (SASFs) in Ag WT and M* BRCA1mut/+ HMECs. The values were determined using qRT–PCR and normalized to proliferating cells (represented by line set at 1). (g) Representative images and summary table of significant genetic and chromosomal events determined by karyotype analysis in hTERT-expressing (immortalized) WT and BRCA1mut/+ HMECs. (h) LOH analysis in M* BRCA1mut/+ HMECs from two patient samples. Student's two-tailed t-test was used to calculate P values. (*) indicates P value within the 0.05 level of significance. Error bar, s.e. Scale bar, 100 μm.

