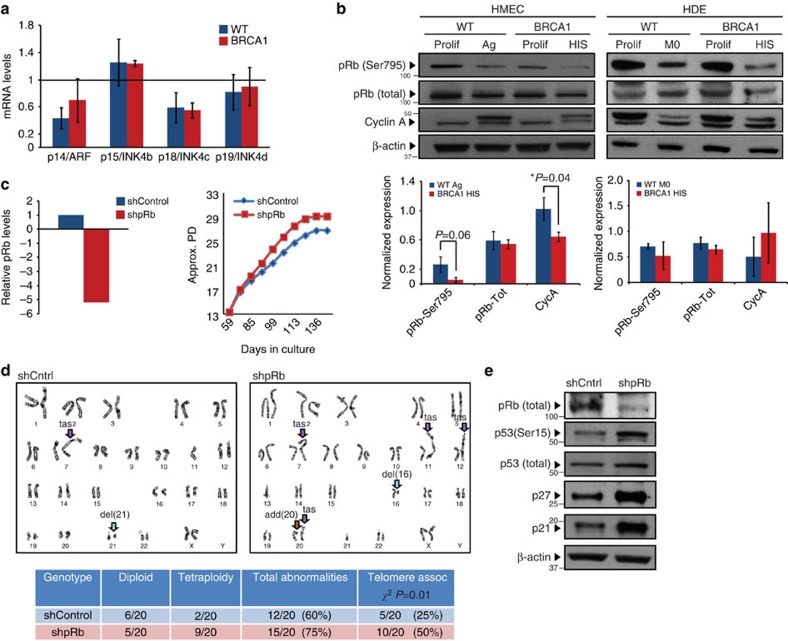
Figure 5. The active pRb signalling pathway mediates HIS.
(a) mRNA levels of p14/ARF, p15/INK4b, p18/INK4c and p19/INK4d in Ag WT and HIS BRCA1mut/+ HMECs. The values were determined using qRT–PCR and normalized to proliferating cells (represented by line set at 1). (b) Western blot analysis of phospho-pRb (Ser795), total pRb and Cyclin A levels in Prolif and Ag/HIS WT and BRCA1mut/+ HMECs and Prolif and M0/HIS WT and BRCA1mut/+ HDEs. Bar graphs bellow the blots show the average levels of phospho-pRb (Ser795), total pRb and Cyclin A levels determined using western blot analysis in Ag WT (n=3) and HIS BRCA1mut/+ (n=3) HMECs and M0 WT (n=3) and HIS BRCA1mut/+ (n=3) HDEs. (c) pRb knockdown in proliferating BRCA1mut/+ HMECs (mRNA levels) and growth curve of control (shScr) and shpRb BRCA1mut/+ HMECs. (d) Representative images and summary table of significant genetic and chromosomal events determined by karyotype analysis in proliferating shScr (control) and shpRb BRCA1mut/+ HMECs. (e) Western blot analysis of pRb, p53 (Ser15), total p53, p21 and p27 levels in growth-arrested shScr (control) and shpRb BRCA1mut/+ HMECs. Student's two-tailed t- and χ2-tests were used to calculate P values. (*) indicates P value within the 0.05 level of significance. Error bar, s.e.

