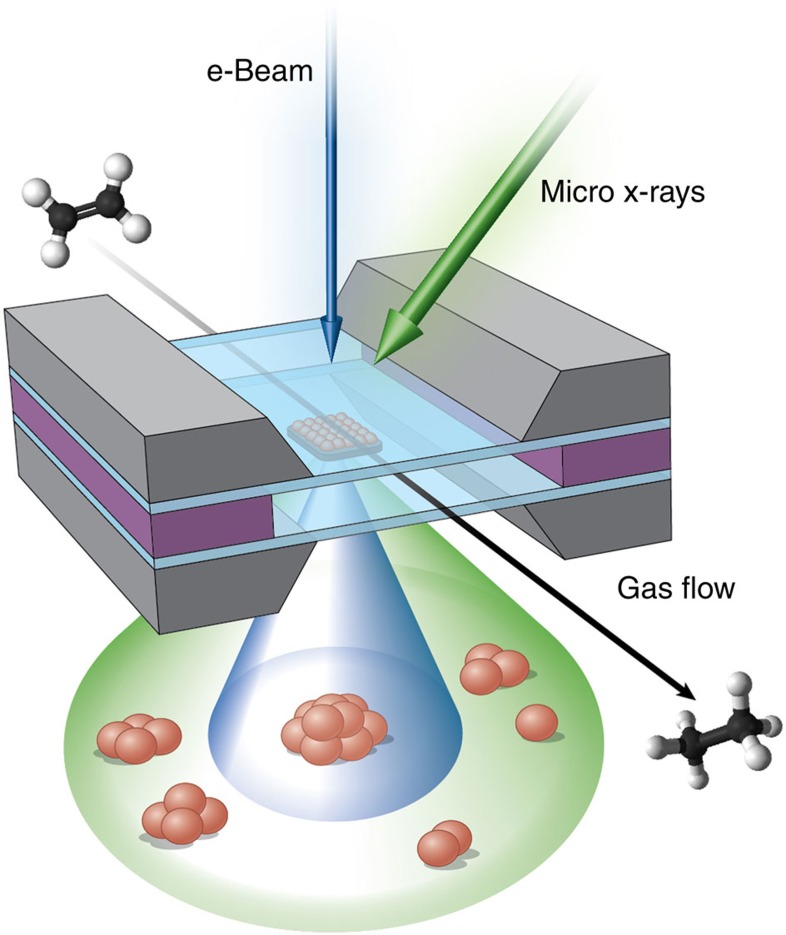
Figure 1. Schematic of experimental cell.
The catalyst is confined between two silicon nitride windows with the reacting gas mixture flowing through the system. Arrows show the direction of the electron beam and incident X-ray beam. In the X-ray absorption experiment, all types of Pt species are probed (shown by a green cone). In the STEM experiment, only particles larger than ∼1 nm are detectable (shown by a dark blue cone).

