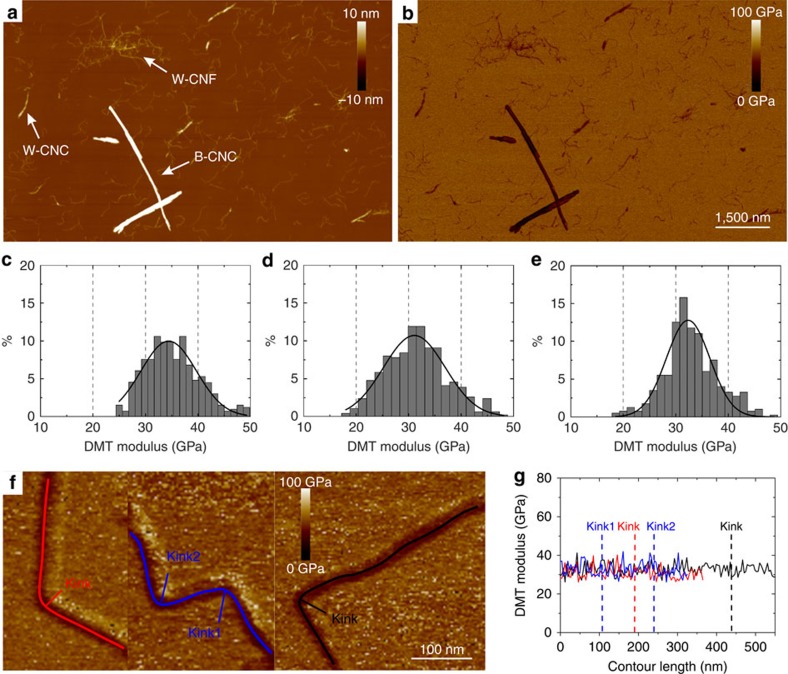
Figure 3. Peak force quantitative nanomechanical mapping.
(a) AFM height channel visualizing the composition of all nanocellulose samples mixed in 1:1:1 proportion. The nanocellulose particles are distinguished and labelled according to their morphological features. (b) The corresponding PF-QNM map. The scale bar applies to both a,b panels. (c–e) DMT modulus distributions measured on particles representing (c) W-CNF, (d) W-CNC and (e) B-CNC. (f) PF-QNM images of W-CNFs and their profiles represented by red, blue and black lines. (g) Mechanical properties along the profiles of fibrils shown in f and the corresponding kink positions.

