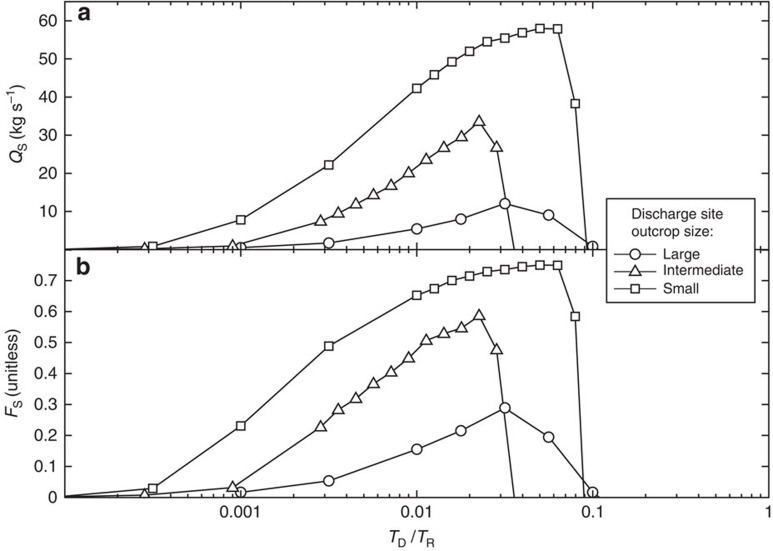
Figure 3. Outcrop-to-outcrop siphon behaviour for simulations having different outcrop sizes.
(a) Siphon flow rate, QS. (b) Siphon fraction, FS. Outcrop geometries defined in Table 1. Each point represents a simulation run to dynamic steady state. Crustal aquifer permeability is kaq=10−12 m2, and a large siphon–recharge outcrop (A=14.1 km2) has permeability koc=10−12 m2, for all results shown. Permeabilities in the siphon–discharge outcrop differ for each simulation, as shown by the ratio of outcrop transmittance (TD/TR). Each geometry results in peaks for FS and QS when 0.02<TD/TR<0.07, and siphons fail to sustain when TD/TR >0.1.

