Figure 5.

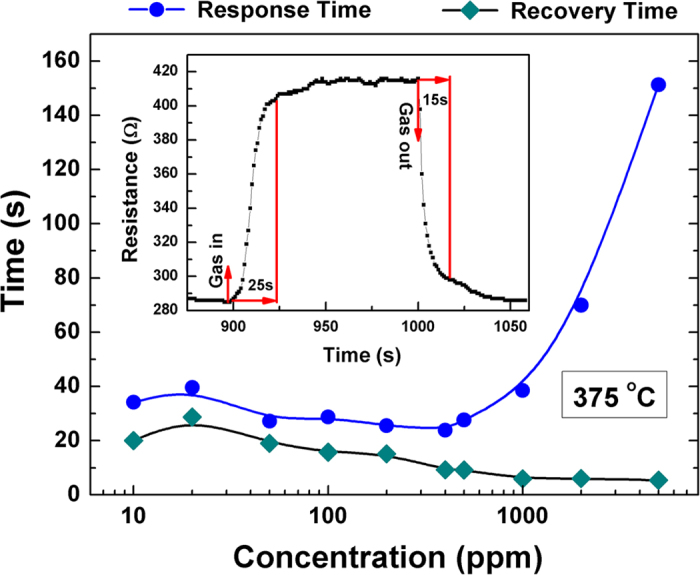
The plot of response time and recovery time of the LBCO gas sensors during the change of air to various ethanol vapor concentrations at 375 °C, the inset shows the definition of the response and recovery times.

The plot of response time and recovery time of the LBCO gas sensors during the change of air to various ethanol vapor concentrations at 375 °C, the inset shows the definition of the response and recovery times.