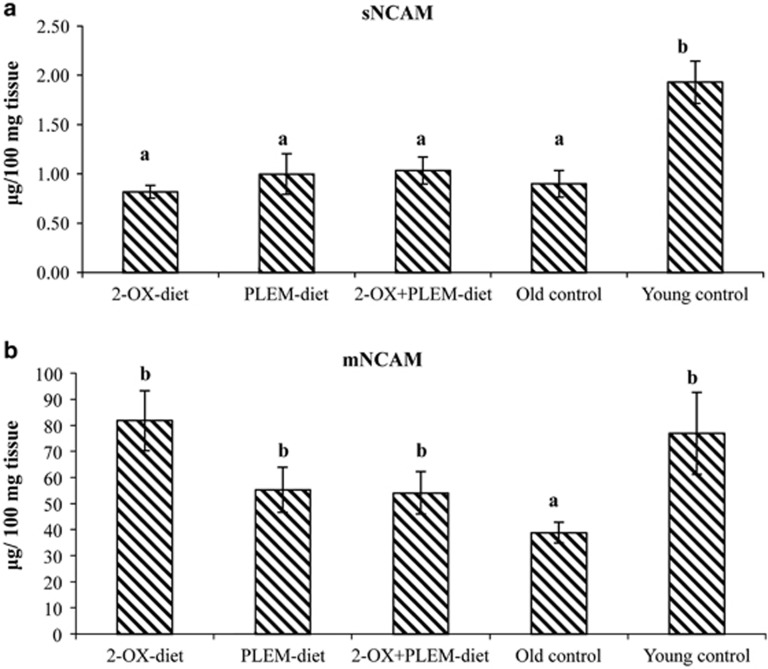
Figure 3.
The distribution of soluble (a) and membrane (b) forms of NCAM of gerbil hippocampus. 2-OX-diet group—old MGs treated with 2-OX-enriched diet (n=14); PLEM-diet group—old MGs treated with PLEM-enriched diet (n=14); 2-OX+PLEM group—old MGs treated both with 2-OX and PLEM (n=17); old control group—control old MGs (n=18); young control group—young MGs (6 months; n=6). Data presented as mean±s.d. a,b,cMean values with unlike letters were significantly different between the groups (P⩽0.05).

