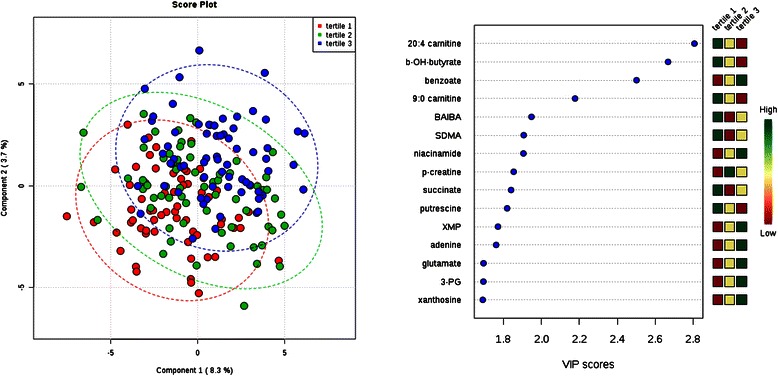
Fig. 2.

Comparison of metabolite profiles across tertile of body mass index (BMI). Study subjects were grouped by BMI tertile (tertile 1 = lowest BMI). Left: Partial least squares discriminant analysis (PLS-DA) score plot for the study population separated by phenotype class. Oval outlines denote 95 % confidence intervals. Right: The variable importance in projection (VIP) scores for the 15 metabolites with the greatest score. The colored boxes on the right indicate the direction of metabolite alterations across phenotype tertile. Abbreviations: BAIBA, β-aminoisobutyric acid; SDMA, symmetric dimethylarginine; 3-PG, 3-phosphoglycerate; b-OH-butyrate, β-hydroxybutryate; p-creatine, phosphocreatine; XMP, Xanthosine-5-phosphate
