
Fig. 1.
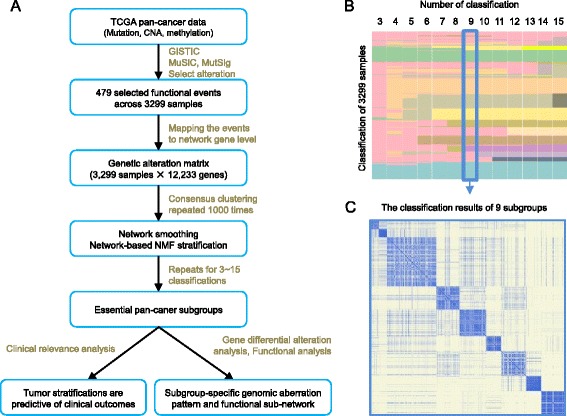
Overview of the pan-cancer stratification analysis. a Flowchart of the main computational procedure. b The landscape of pan-cancer subgroups with k = 3 ~ 15 classes obtained from the consensus NBS clustering. Each row denotes a sample, and each column presents a classification. Different colors in each column denote different subgroups. c The heat map of the co-clustering matrix of the 9 subgroups obtained from the consensus NBS clustering