
Fig. 5.
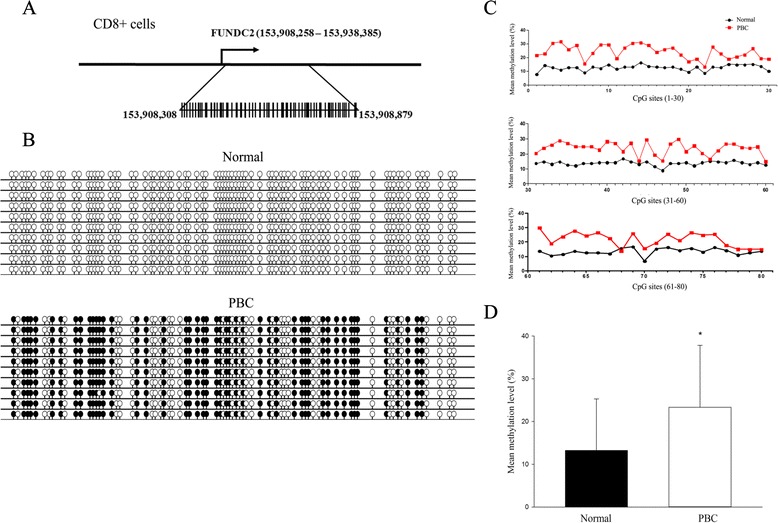
a Chromosomal sequence location of the region of the FUNDC2 promoter that was analyzed by bisulfite sequencing. This region contains 80 CpG sites (vertical bars) within a 696 bp region close to the transcription start site as shown. b Representative bisulfite sequencing data from CD8+ cells of a PBC sample and a normal control, respectively. Each circle represents a CpG site, and each line represents an individually sequenced clone. Filled circles represent methylated sites (protected from bisulfite conversion), while unfilled circles represent unmethylated CpG sites (converted). c Mean methylation level was calculated for each individual CpG site within the FUNDC2 promoter region for all clones for PBC (n = 20) versus healthy (n = 20) CD8+ cells. d Overall percentage of methylation of FUNDC2 was determined by the total number of methylated sites out of the total CpG sites in all clones and graphed as mean ± SD for PBC (n = 20) versus healthy (n = 20) CD8+ cells. *p < 0.05