
Fig. 7.
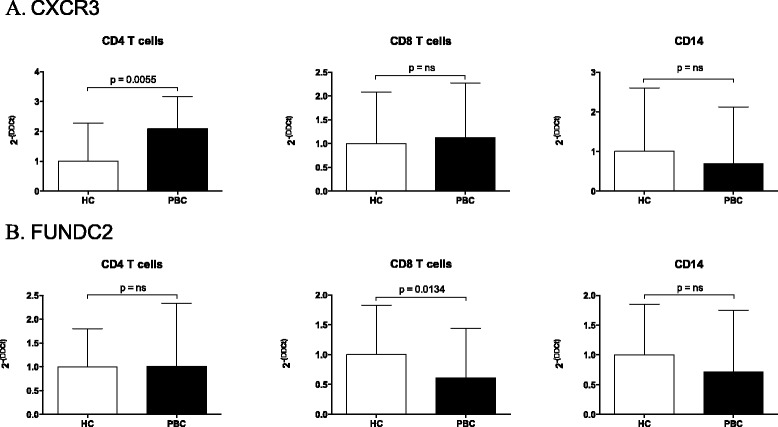
CXCR3 (a), and FUNDC2 (b) expression level was determined in CD4+, CD8+ T cells, and CD14+ cells in PBC patients and controls. Real-time threshold cycle values for cDNA were normalized with GADPH and compared to a calibrator. Limits (95 % CI) of the best-fit line are shown