
Fig. 8.
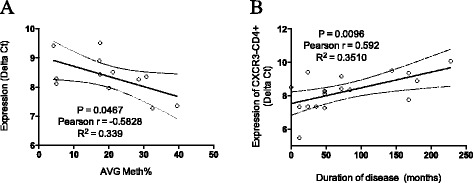
Correlation analysis was performed to evaluate the relationship between CXCR3 gene expression levels, methylation status of CXCR3 promoter, and disease duration. a CXCR3 expression in CD4+ T cells inversely correlates with methylation status of CXCR3 promoter. b CXCR3 expression in CD4+ T cells correlates with disease duration. Real-time threshold cycle values for CXCR3 cDNA were normalized with GADPH and compared to a calibrator. Calibrated CXCR3 expression levels were correlated to disease duration (months). 95 % confidence limits of the best-fit line are shown (solid line)