
Fig. 9.
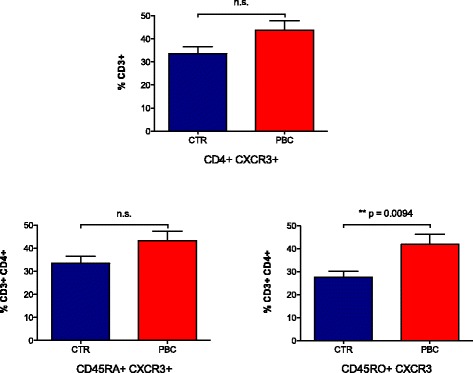
CD4 T cell populations expressing CXCR3 in PBC (n = 20) and controls (n = 10) were quantified by flow cytometry. In PBC, there is an increased number of CD4 T cells in the periphery expressing CXCR3, in both naïve (CD45RA) and memory cells (CD45RO). Activated CD4+CD45RO+ cells express significantly higher levels of CXCR3 in PBC (41.82 % ± 4.37) compared to controls (27.57 % ± 2.61) (p = 0.0094)