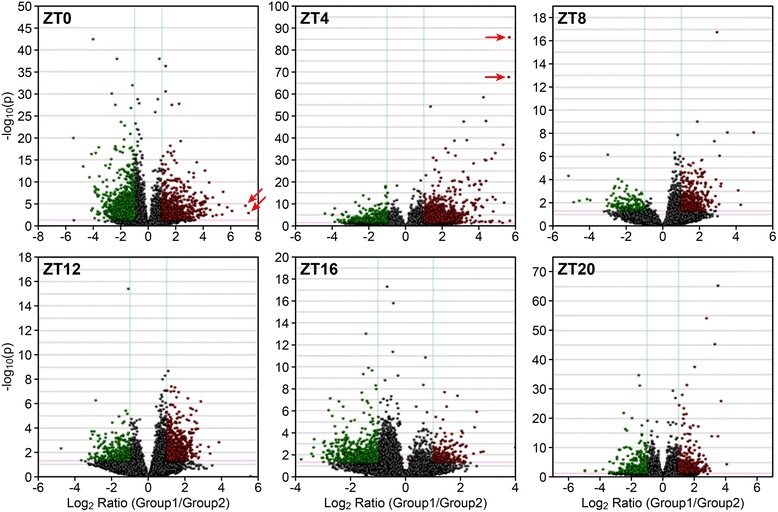
Fig. 1.

Volcano plots. Expression data were plotted on a log2 scale (x-axis) versus a -log10 transformation of the p-value (y-axis). Datasets were filtered to remove genes with low expression levels (blue lines from -1 to 1 on the x-axis), and a significance cut off (p < 0.01) was applied (red line on the y-axis). ZT0 (n = 2218; 582 up and 1636 down); ZT4 (n = 1290; 856 up and 434 down); ZT8 (n = 207; 175 up and 32 down); ZT12 (n = 497; 448 up and 49 down); ZT16 (n = 175; 73 up and 102 down); and ZT20 (n = 479; 273 up and 206 down). Arrows indicate the highest expression in ZT0 (Glyma18g43980 and Glyma10g38050) and the highest confidence in ZT4 (Glyma03g24320 and Glyma17g13720)
