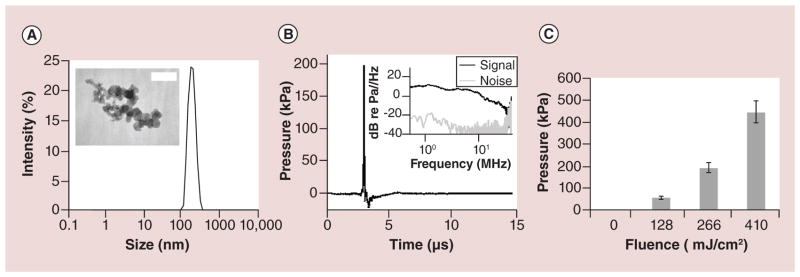
Figure 1. Physical characterization of carbon black nanoparticles.

(A) Representative dynamic light scattering measurement of hydrodynamic diameter of carbon black (CB) nanoparticle aggregates in DI water suspension at a final concentration of 25 μg/l shows a single peak and no particle settling. Transmission electron microscope image (inset) of dried CB nanoparticle aggregates shows the individual spherules constituting the aggregates. The scale bar is 50 nm. (B) Representative acoustic output (pressure) vs time measured using a hydrophone when CB nanoparticle suspension (50 mg/l) was exposed to a single laser pulse at 250 mJ/cm2 fluence. The frequency distribution calculated from the hydrophone calibration curve reveals a broadband signal up to approximately 30 MHz (inset). (C) Peak acoustic pressure shown as a function of laser fluence. Peak pressure increased with increasing fluence. Data show mean ± standard deviation with more than 100 replicates each (n > 100).
