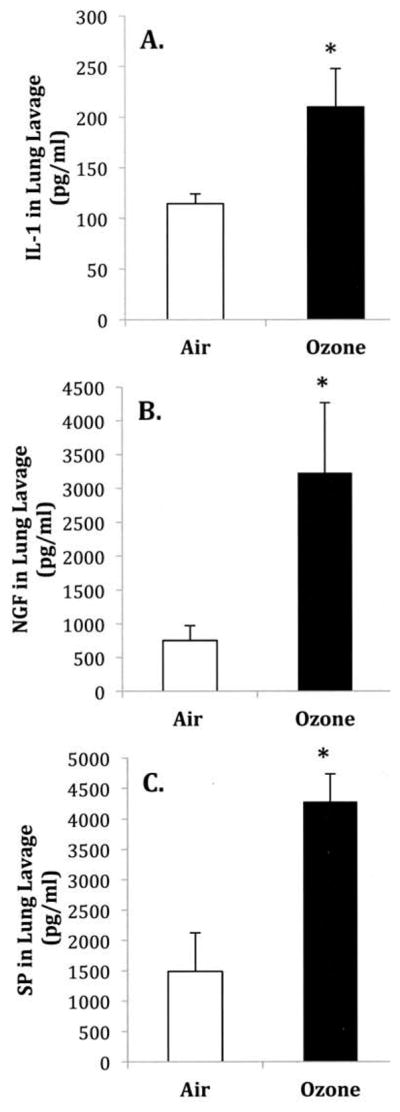
FIGURE 1.

The effect of O3 exposure on (A) IL-1β, (B) NGF, and (C) SP protein levels in bronchoalveolar lavage fluid. Protein levels were measured by ELISA 24 h after filtered air (FA) or O3 (2 ppm, 3 h) exposure. (A) NGF levels, (B) NGF levels, and (C) SP levels. Values are means ± SE of 4–6 mice/group. Asterisk indicates significant difference between FA- and O3-exposed animals, p ≤ .05.
