
Figure 4.
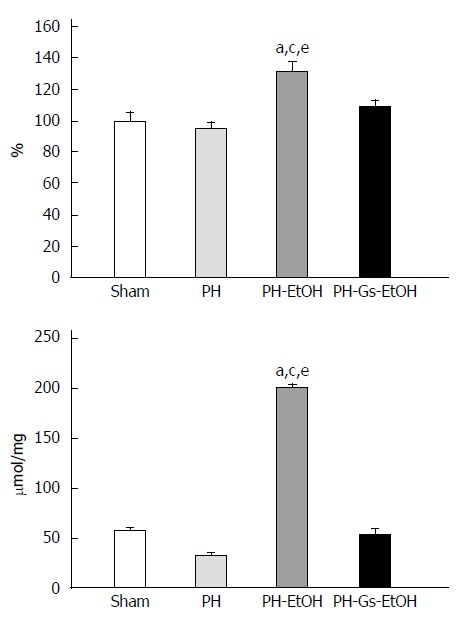
Thiobarbituric acid reactive substances concentration in serum (upper panel) and in the liver (lower panel) during liver regeneration and intoxication with ethanol. Values are expressed as the mean ± SE (n = 5-6). aP < 0.05 vs sham group; cP < 0.05 vs PH group; eP < 0.05 vs PH-Gs-EtOH group. PH: Partial hepatectomy; EtOH: Ethanol; Gs: Geranium schiedeanum.