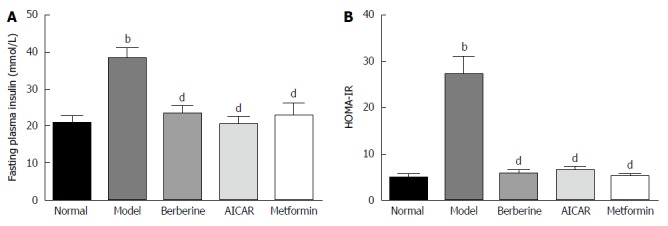
Figure 2.

Effects of berberine on fasting plasma insulin level and homeostasis model assessment of insulin resistance in diabetic rats. Each bar represents the mean ± SD (n = 8). bP < 0.01 vs the normal control group; dP < 0.01 vs the model group (by ANOVA). HOMA-IR: Homeostasis model assessment of insulin resistance.
