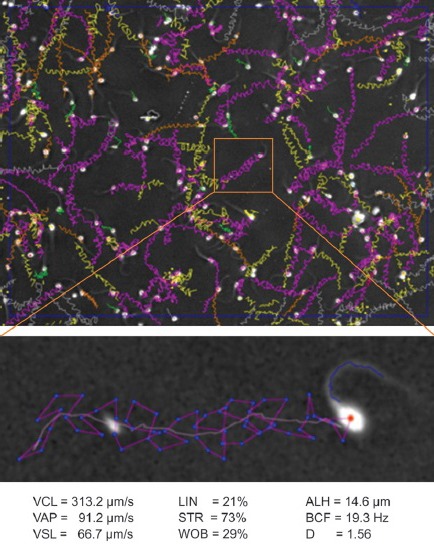
Figure 1.

The upper panel shows the reconstructed sperm tracks in one analysis field of the IVOS-II system (1 s @ 60 Hz), purple tracks are ones that have passed the Boolean sort argument for being hyperactivated. The lower panel shows the zoomed image of one of these tracks including the spermatozoon at the start of the track; note the high curvature wave, characteristic of a hyperactivated spermatozoon, present in the proximal region of the tail. The cell's kinematic values are shown at the bottom of the figure, including the fractal dimension, D, clearly confirming hyperactivation.60
