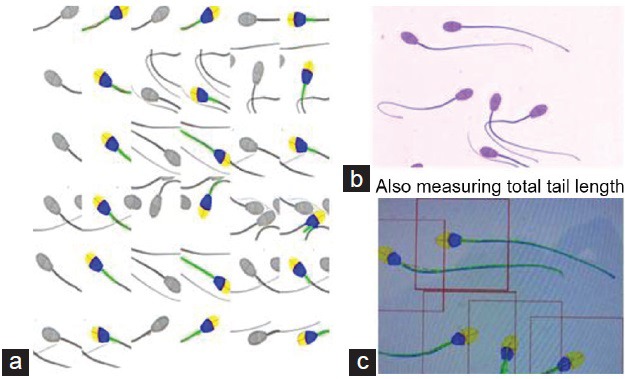
Figure 3.

(a) SCA analysis of ram spermatozoa showing three columns of paired images of spermatozoa, in each of which the left sub-column is the original image and the right sub-column is the automated analysis of each spermatozoon; yellow = acrosome; blue = rest of head; green = anterior part of midpiece. (b) Ram spermatozoa stained with SpermBlue; (c) screen shot of the entire spermatozoon including its tail as analyzed by the SCA.
