
Figure 1.
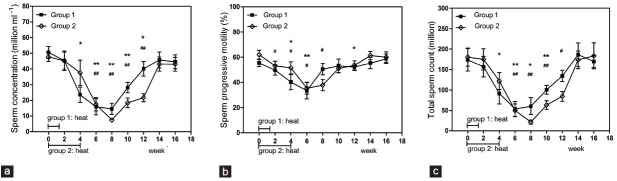
Mean (±s.e.m.) sperm concentration (a), sperm progressive motility (b) and total sperm count (c) before and after treatment in the 2 groups of subjects. *P < 0.05 when compared with baseline in Group 1; **P < 0.01 when compared with baseline in Group 1; #P < 0.05 when compared with baseline in Group 2; ##P < 0.01 when compared with baseline in Group 2.