
Figure 4.
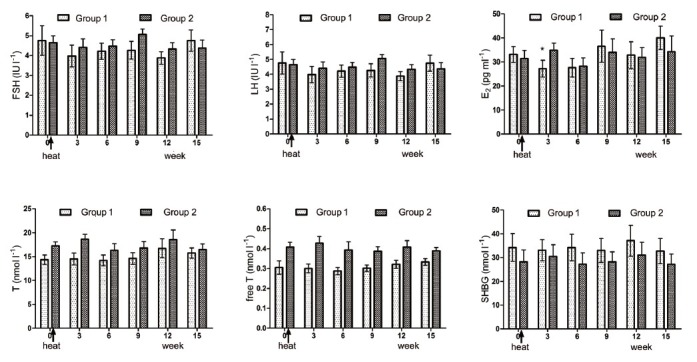
Mean (±s.e.m.) serum follicle-stimulating hormone, luteinizing hormone, estradiol (E2), testosterone (t), free T and sex hormone-binding globulin before and after treatment in the 2 groups of subjects. *P < 0.05 when compared with baseline in Group 1. All P > 0.05 when compared with baseline levels except for E2 test at week 3 in Group 1 (P = 0.037).