
Figure 6.
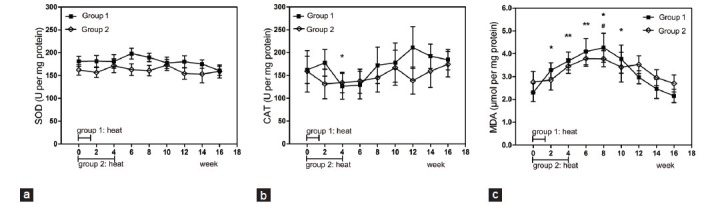
Mean (±s.e.m.) seminal plasma SOD (a), CAT (b) and MDA (c) content before and after hyperthermia in the 2 groups of subjects. *P < 0.05 when compared with baseline in Group 1; **P < 0.01 when compared with baseline in Group 1; #P < 0.05 when compared with baseline in Group 2; ##P < 0.01 when compared with baseline in Group 2. SOD: superoxide dismutase; CAT: catalase; MDA: malondialdehyde.