Figure 2.

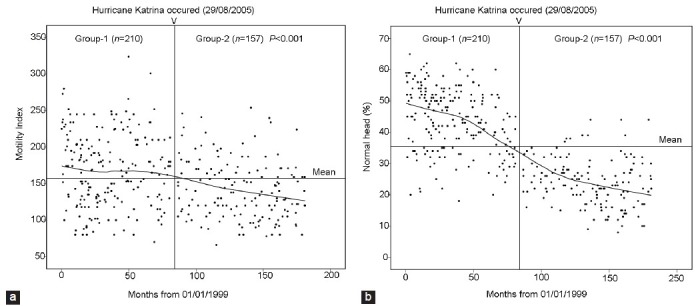
Changes in motility index between two groups over the time (a); and changes in normal head morphology between two groups over the time (b).

Changes in motility index between two groups over the time (a); and changes in normal head morphology between two groups over the time (b).