
Fig. 3.
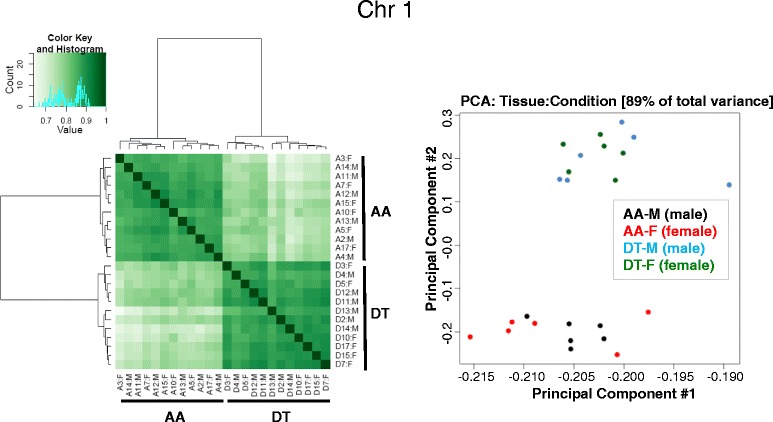
Correlation heatmap and Principal Component Analysis (PCA) distinguishes site-specific DMRs in both male (M) and female (F) tissues. Correlation heatmap and PCA plot (generated with the R bioconductor package DiffBind) based on the DMRs between AA and DT are illustrated for chromosome 1. Similar heatmaps and plots for all 18 somatic chromosomes are shown in Additional file 1: Figure S2