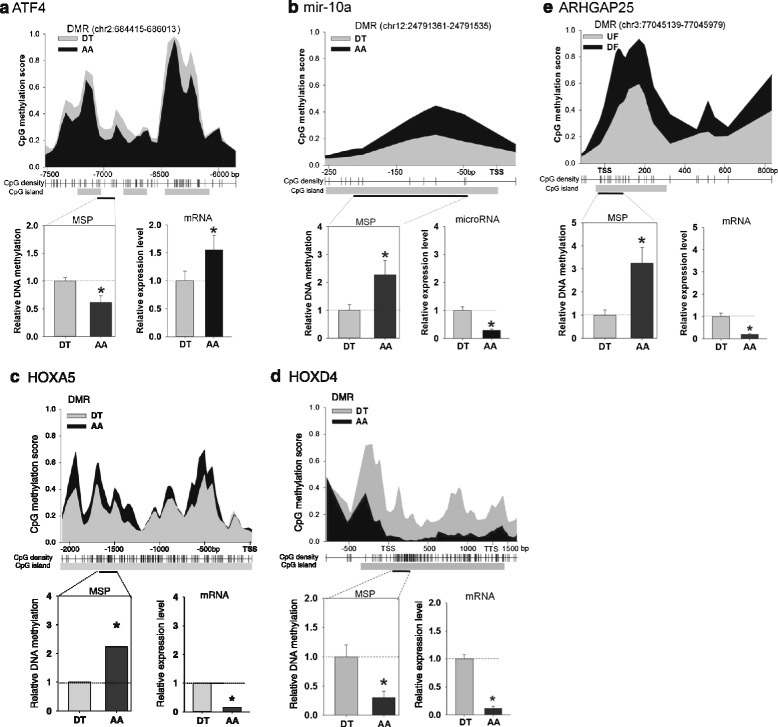
Fig. 7.

MSP analyses of selected DMRs relative to gene expression in athero-susceptible endothelia. Methylation scores and mRNA levels of a ATF4, b microRNA-10a, c HOXA5, d HOXD4 and e ARHGAP25 were measured. The methylation scores of CpG sites were calculated by BALM. 1 = 100 % methylated, 0 = unmethylated. The average methylation scores of AA and DT are shown as black and grey areas respectively (upper panel, n = 12 animals). Distance to the TSS is shown on the x-axis. Relative methylation levels of regions within the DMRs were analyzed by MSP (bottom left). mRNA levels were quantified by qPCR (bottom right). MSP and qPCR data were normalized (See Methods for further details) and are expressed as fold of DT. *indicates significant difference between AA and DT (n = 6, p < 0.05). chr, chromosome. TSS, transcription start site. TTS, transcription termination site. mRNA data for ATF4 and microRNA-10a were adapted from Civelek et al. [6]. and Fang et al. [14]; reprinted with permission.
