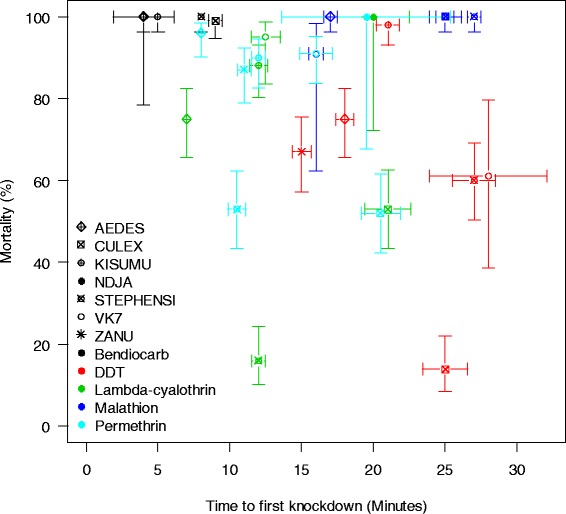
Fig. 2.

Summary plot showing the relationship between 24 h mortality and the time it takes to knockdown 50 % of the population (KDT50) for all strains and insecticides tested in the present laboratory study. Symbols show point estimates and 95 % confidence intervals and colours show the insecticides tested. The confidence intervals for mortality are computed after Wilson [31] and those for KDT using the boxplot function
