
Fig. 1.
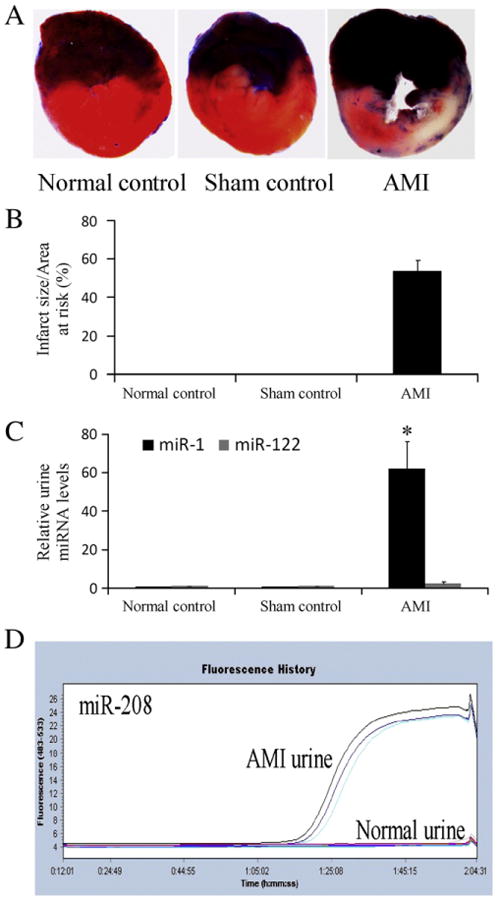
Urine miRNAs from rats with or without acute AMI. (A) AMI was induced by left anterior descending coronary artery ligation and the infarct size was determined by pathological staining in heart slices. Note: Color blue is Evans blue staining. The region without Evans blue staining is myocardial ischemic area at risk (IAR). Color red is the triphenyltetrazolium chloride (TTC) staining. TTC unstained area within IAR was the infarcted area. (B) Infarct size is expressed as a percentage of the IAR (% IAR). (C) The relative urine miR-1 and miR-122 levels in 8 rats without surgery, 8 sham-opened control rats, and 8 rats at 24 h after AMI. n=8, *P<0.001 compared with the control group. (D) The urine levels of miR-208 in rats with and without AMI. Note: The 3 curves above the baseline after 1:05:02 represent the miR-208 signals in urine from 3 AMI rats. In contrast, 3 lines that are still at baseline after 1:05:02 represent 3 normal urine samples without miR-208 signal.