
Fig. 2.
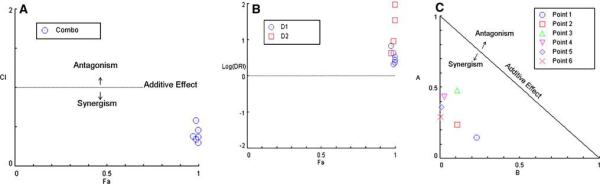
Analysis of clonogenic survival data shown in Fig. 1. A. Combination index (CI) plot based on the Chou-Talalay equation (29-31) and the computerized quantitation (32). The CI was plotted as a function of fractional effect levels (fa) (e.g., for 50% inhibition, fa = 0.5) where CI<1, =1, and >1 indicate synergism, additive effect and antagonism, respectively. B. Normalized isobologram for the non-constant ratio combinations. The normalized doses are given on the y- and x-axis for X-irradiation (D1/Dx1) and carboplatin (D2/Dx2), respectively. When a combination data point falls on the diagonal, it indicates additive effect, and when it falls in the lower left or upper right quadrants of the diagonal, it indicates synergism or antagonism, respectively (31). C. Fa-DRI plot where the dose-reduction index (DRI) was plotted as a function of the fractional effect levels (fa). DRI indicates how many folds dose-reduction would be allowed at a given effect for the synergistic combination. Therefore, DRI>1 or log (DRI)>0 indicates favorable dose-reduction, and DRI<1 or a negative log (DRI) value indicates an unfavorable dose reduction (31). The log (DRI) used here was selected to avoid high DRI values from falling out of scale. All plots were generated automatically by computer software (32) after entering dose-effect data into the computer for the drug alone or X-irradiation, and their combinations.