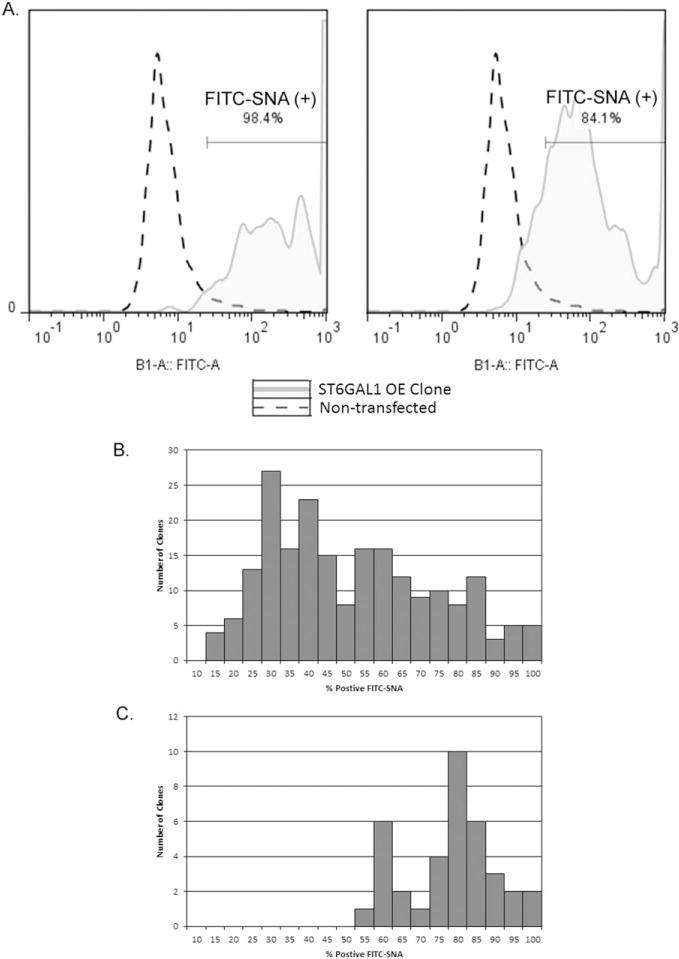
Figure 4. FITC-SNA staining of single-cell clones derived from the CHOZN® GS enriched ST6GAL1 stable pool.

A. FACS histograms of two representative single-cell clones overexpressing ST6GAL1 stained with FITC-SNA lectin. B. Histogram of % FITC-SNA (+) cells of the clones isolated from the FITC-SNA enriched pool overexpressing ST6GAL1 (N=208) in static 96-well cultures. C. Histogram of % FITC-SNA (+) cells of the clones with the highest % FITC (+) selected from the clones depicted in Panel B (N=35) in static 24-well cultures.
