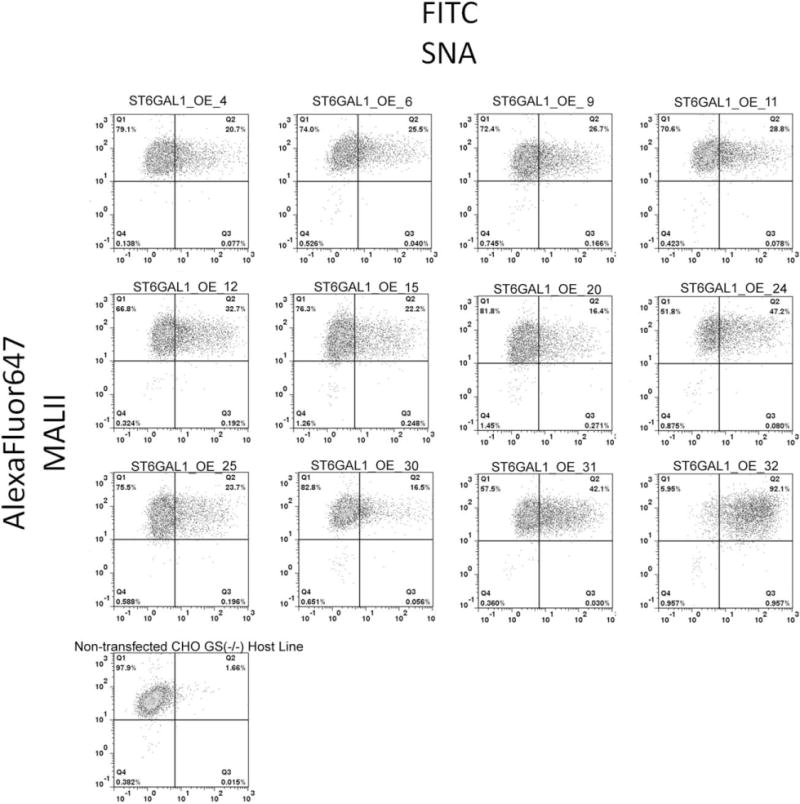
Figure 5. Two-color FACS analysis of SNA and MALII lectin staining of ST6GAL1 overexpression clones.

Representative scatter plots with quadrant analysis from the 12 clones overexpressing ST6GAL1 are shown here. The X-axis is fluorescence of FITC-SNA. The Y-axis is fluorescence of AlexaFluor647, representing MALII lectin staining. Each quadrant is labeled with % of total population. The gating was set based on streptavidin-AlexaFluor647 only of each OE clone (scatter plots not shown here) and based on FITC of the nontransfected host cell line, respectively, to exclude background fluorescence.
