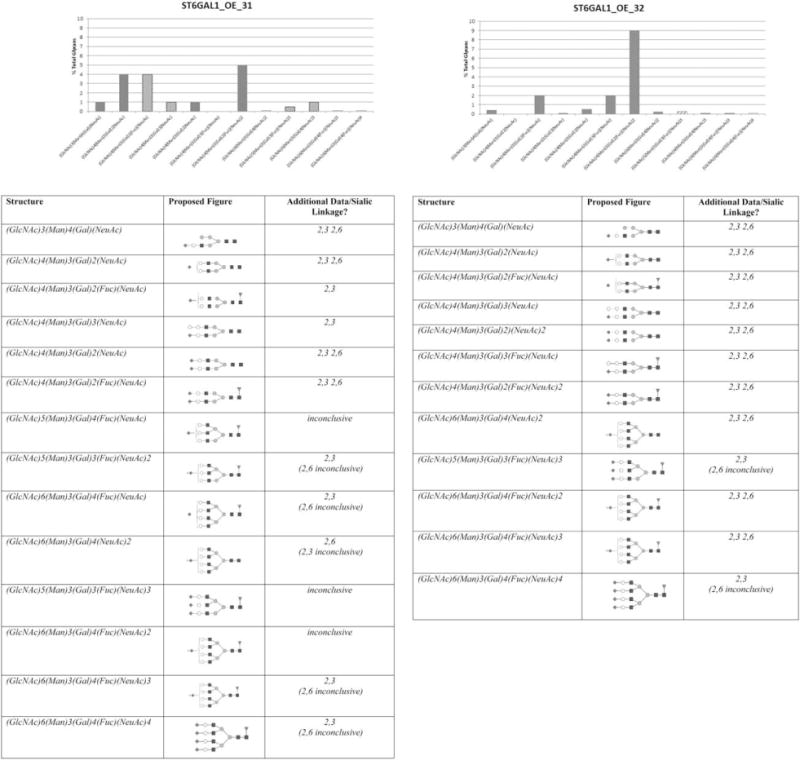
Figure 8. Semi-quantitative analysis of sialylated N-glycans.

The tables summarize the glycoform structure and the sialic acid linkage of all N-glycans containing sialic acid. The percentage of each glycan was calculated by totaling intensities for each peak and calculating percentages from the sum. The solid columns in the graphs indicate both α2,3- and α2,6-linked sialic acid. The dashed columns indicate α2,3-linkage.
