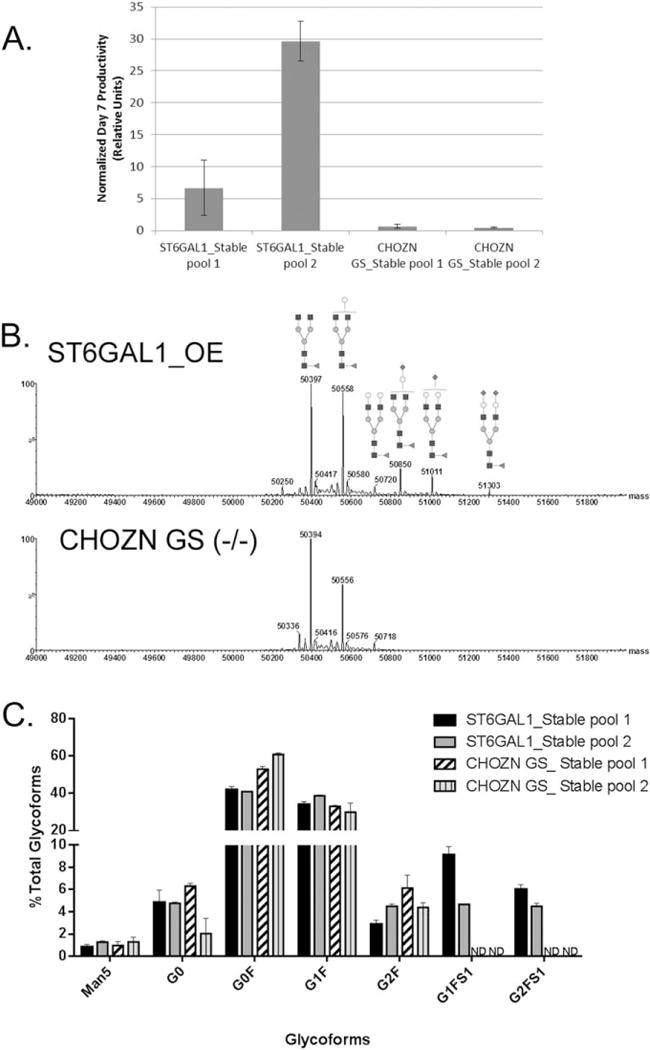
Figure 9. Stable pool productivity and glycoform profiles of IgG produced in ST6GAL1 OE host cell line by intact protein mass.

A. Day 7 IgG productivity from two stable pools generated from different transfections. The IgG concentrations were normalized by that of the CHOZN GS_Stable pool 1 collected from the first experiment. Error bars represent three independent cell culture experiments. B. The representative mass spectra of the IgG glycoform profiles of a stable IgG-producing “bulk” pool derived from ST6GAL1_OE_32 and a stable pool from the CHOZN® GS host cell line. The top pane shows the de-charged mass spectrum of IgG heavy chain from ST6GAL1_OE_32. Annotated mass peaks are consistent with glycoforms bearing the indicated glycans. Species 50850, 51011, and 51303 are sialyated. The bottom pane shows the mass spectrum of IgG heavy chain from the CHOZN® GS host cell line. C. The IgG glycoform distribution (% of total glycoforms) of two stable pools derived from ST6GAL1_OE_32 and two stable pools from the CHOZN® GS host cell line. G2SA2F (51303) is below quantification limit. Error bars represent three independent cell culture experiments.
