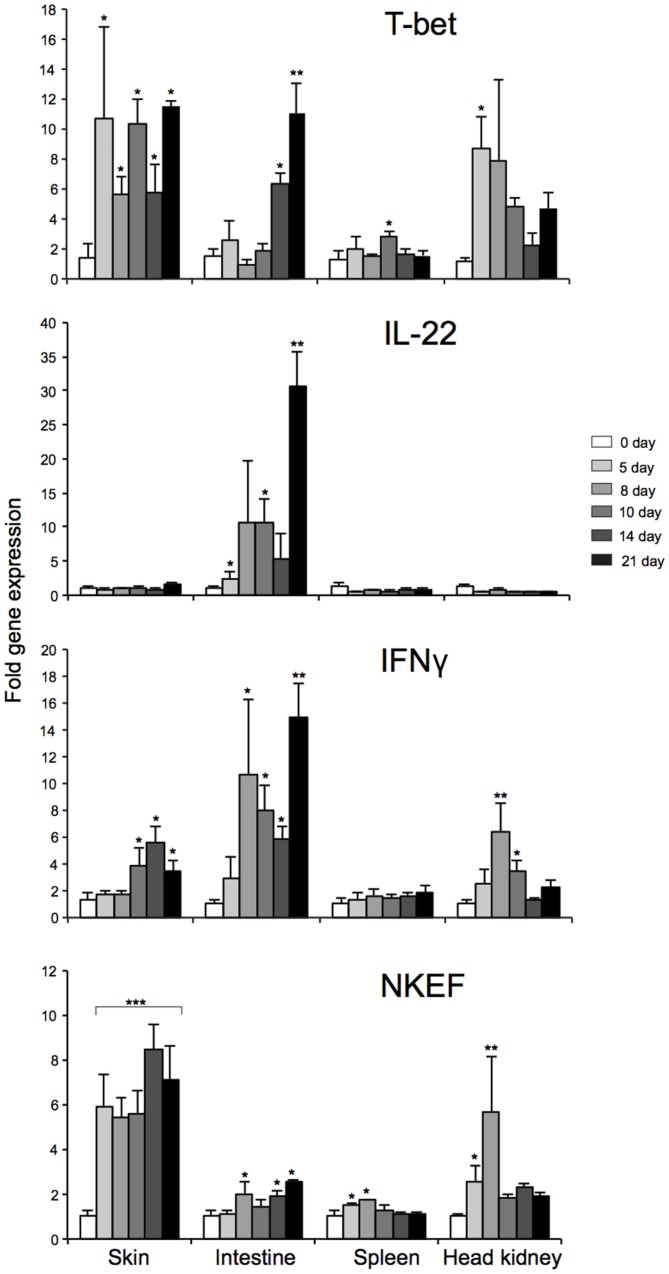
Figure 7.
Tissue specific expression of T-bet, IL-22, NKEF, and IFNγ in infected Atlantic salmon at different time-points after water-borne infection with A. salmonicida. Bars represent the relative expression levels of T-bet, IL-22, NKEF, and IFNγ normalized to EF-1α. Each value represents the mean ± SEM (n = 4). Statistical differences (P < 0.05, P < 0.01, and P < 0.001) between different time-points compared to control are indicated by asterisk (*,**, and ***) respectively, above the bars.

