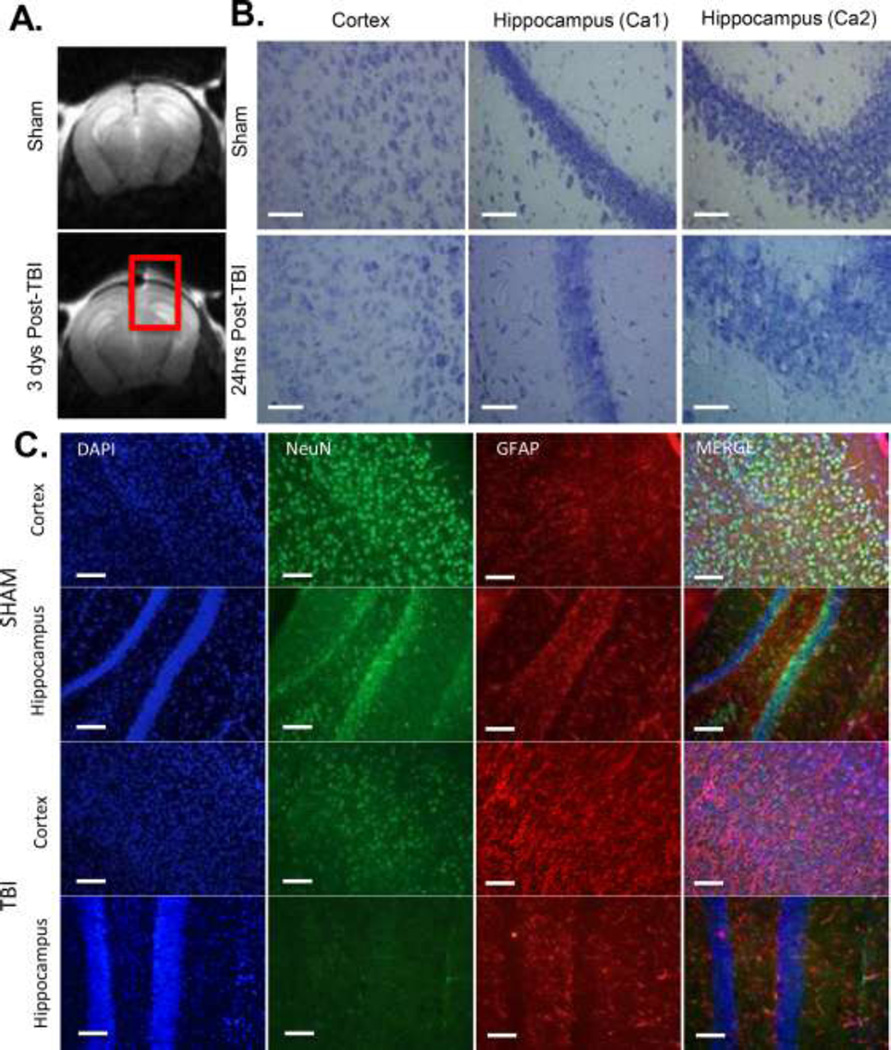
Figure 1. Imaging measures of mTBI.
A) Structural MRI of WT mouse brain 3 days post-TBI. Red Square encompasses area of direct impact. N=3 B) Nissl stain(40× magnification, line=500µm) of sham and TBI treated WT mouse cortex and hippocampus (Ca1 and Ca2 regions) 24 hours post-TBI. N=4 C) DAPI (Blue), NeuN (Green) and GFAP (Red) (20× magnification, line=100µm) used to label nuclei, neurons and astrocytes in the ipsilateral (Injured) cortexand hippocampus of Sham and TBI animals 24 hours post-TBI. N=3

