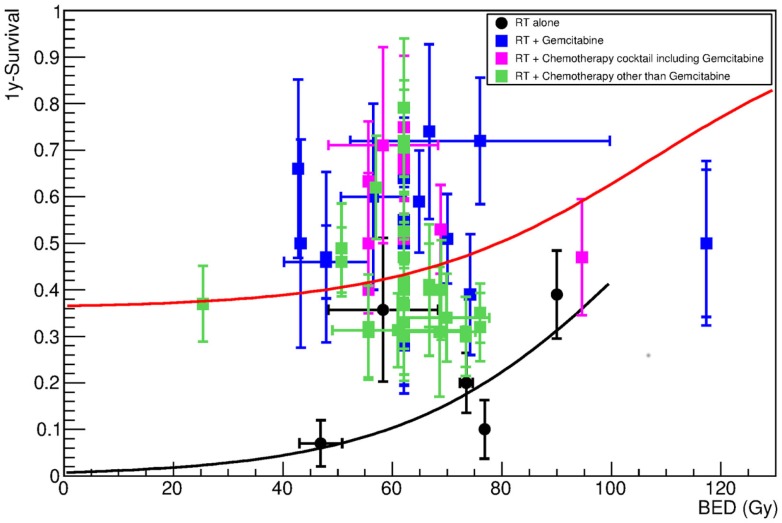
Figure 4.
One-year survival as a function of the BED for patients undergoing X-ray radiotherapy alone (black symbols), or in combination with any chemotherapy treatments. Details about chemotherapy regimen are reported in Tables 4–6. The lines show the result of the fit (black for radiotherapy-alone data, red for all chemotherapy data pooled together), which was performed assuming that γ50 and D50 are obtained by fitting RT-alone data. Fitting parameters with Eq. 3 are in Table 3.

