
Figure 3.
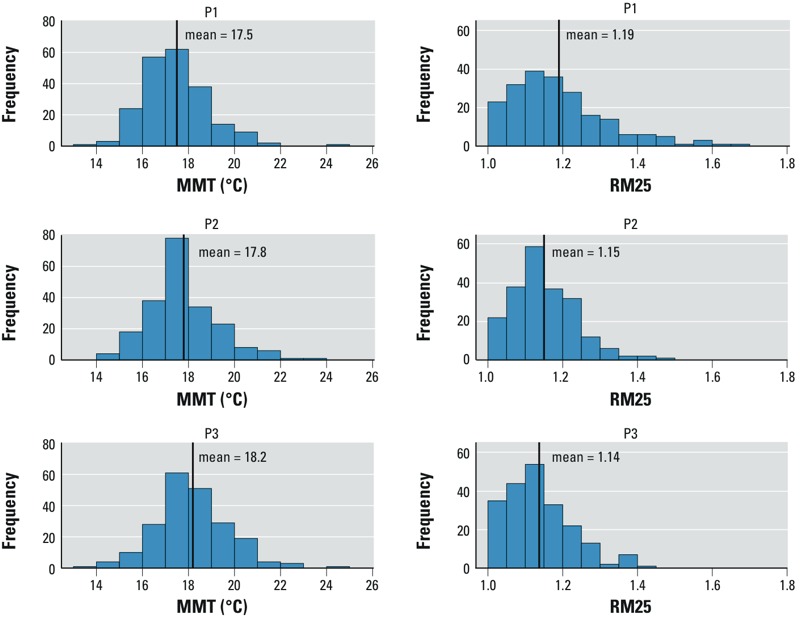
Distributions of minimum mortality temperatures (MMT) and relative risk of mortality expressed as the ratios of mortality observed at 25°C to that observed at MMT (RM25), computed for three successive periods in France (1968–2009).
Official websites use .gov
A
.gov website belongs to an official
government organization in the United States.
Secure .gov websites use HTTPS
A lock (
) or https:// means you've safely
connected to the .gov website. Share sensitive
information only on official, secure websites.
Distributions of minimum mortality temperatures (MMT) and relative risk of mortality expressed as the ratios of mortality observed at 25°C to that observed at MMT (RM25), computed for three successive periods in France (1968–2009).