
Figure 3.
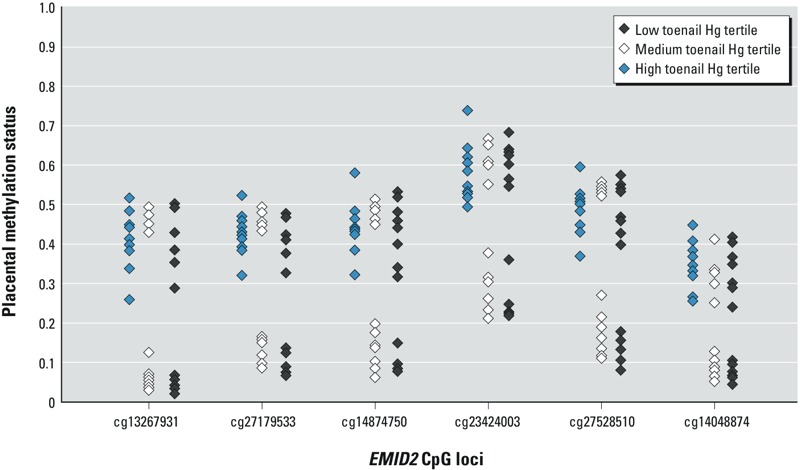
Plot of six Hg- and high-risk profile–associated EMID2 loci in 41 samples with Hg data by tertile. y-Axis represents EMID2 methylation β-value. Loci in order of appearance (+ strand, 5’ to 3’).
Official websites use .gov
A
.gov website belongs to an official
government organization in the United States.
Secure .gov websites use HTTPS
A lock (
) or https:// means you've safely
connected to the .gov website. Share sensitive
information only on official, secure websites.
Plot of six Hg- and high-risk profile–associated EMID2 loci in 41 samples with Hg data by tertile. y-Axis represents EMID2 methylation β-value. Loci in order of appearance (+ strand, 5’ to 3’).