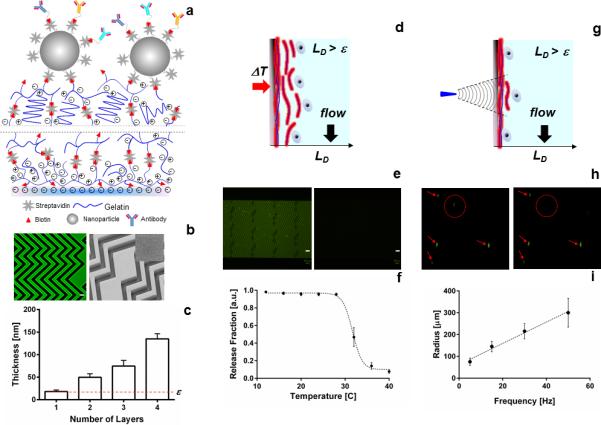
Figure 1. Nanocoating characterization.

(a) Schematic of the modified LBL nanocoating at the surface of a microfluidic device. Lines indicate the process is repeated four times. (b) Left, confocal micrograph of the nanocoating using streptavidin-FITC; right, electron microscopy image of the coating with the insert showing a high-resolution imaging of the surface, scale bar represents 50 μm. (c) Thickness-growth curve of the deposited layers. (d) Cartoon of the bulk release mechanism for the nanocoating. (e) Fluorescence microscopy images of the coating before (left) and after degradation, scale bar represents 200 μm. (f) Quantification of the release fraction of microbeads immobilized on the surface of the nanocoating. (g) Cartoon of the single cell / selective release mechanism. (h) Micrographs of a single cell being released from the nanocoating. In the left image, the cell targeted for release is identified with a dotted red circle; all other cells that should remain are marked with red arrows. The right image was taken after applying localized shear stress with our microtip, releasing only the target cell. (i) Size of the release radius based on the magnitude of the frequency of vibration of the microtip.
