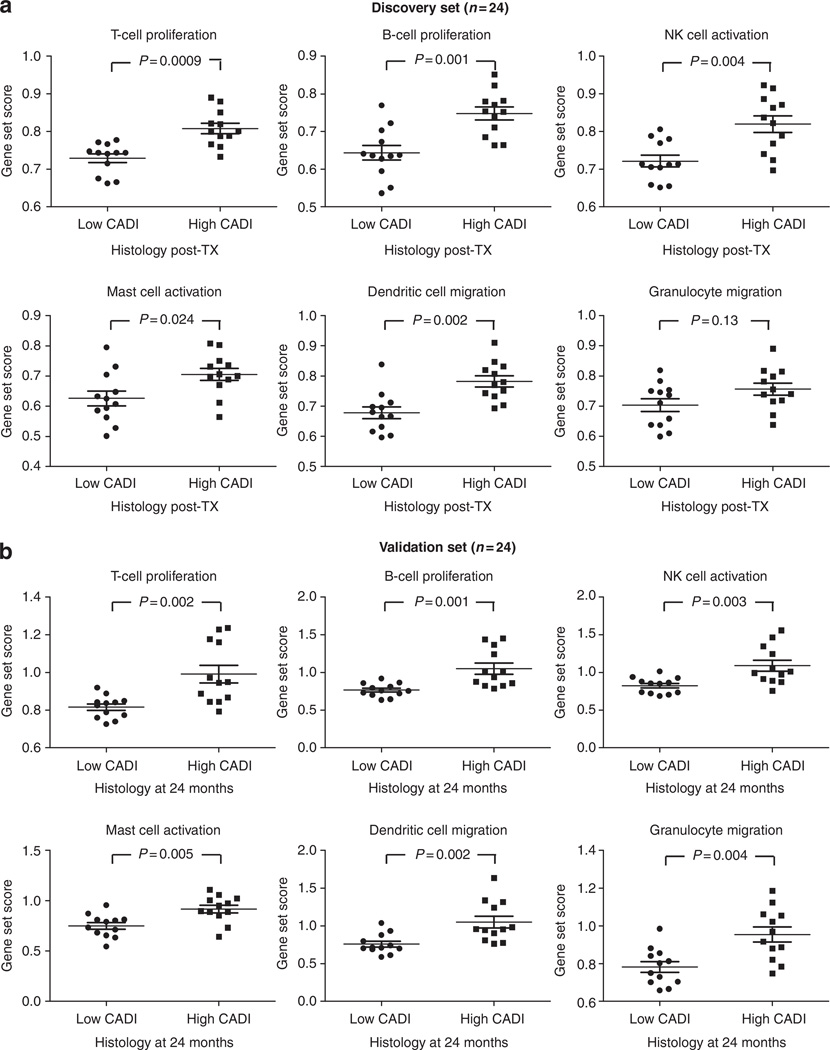
Figure 2. Gene expression and CADI score (Project 1).
After significance analysis of microarrays, comparing gene expression of biopsies with high versus low CADI score, the probe set lists were analyzed using the Ingenuity Pathway Analysis program (Ingenuity Systems) and demonstrated highly significant enrichment of immune genes. The immune gene set scores represented in the graphs were calculated as the geometric mean of fold changes (unlogged values) across all probe sets (not only the significant probe sets) within the Ingenuity Pathways Knowledge Base (IPKB) lists for the different immune cell functions (Supplementary Table S5 online). (a) Comparison of the immune gene set scores between biopsies with high versus low CADI scores in a discovery set (n=24) and (b) in a validation set (n=24). P-values represented in the graphs were calculated using Mann–Whitney tests. The error bars represent mean±standard error of the mean. CADI, Chronic Allograft Damage Index; NK, natural killer; TX, transplantation.

