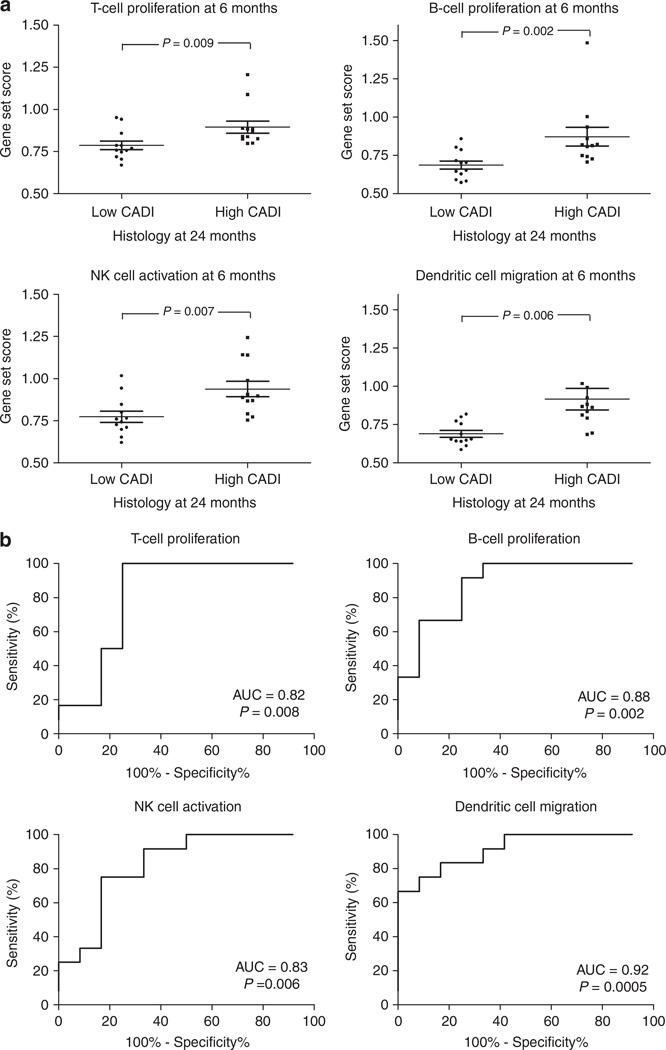
Figure 4. Association of 6 months gene expression with CADI score at 24 months (Project 3).
(a) After significance analysis of microarrays, comparing gene expression of 6-month biopsies of progressors versus nonprogressors, the probe set list was analyzed using the Ingenuity Pathway Analysis program (Ingenuity Systems) and demonstrated significant enrichment of immune genes. The immune gene set scores represented in the graphs were calculated as the geometric mean of fold changes (unlogged values) across all probe sets (not only the significant probe sets) within the Ingenuity Pathways Knowledge Base lists for the different immune cell functions (Supplementary Table S5 online). P-values represented in the graphs were calculated using Mann–Whitney tests. The error bars represent mean±standard error of the mean. (b) Receiver operating characteristic-curve analysis demonstrates good accuracy of the 6-month immune gene set scores for prediction of subsequent damage. AUC, area under the curve; CADI, Chronic Allograft Damage Index; NK, natural killer.

