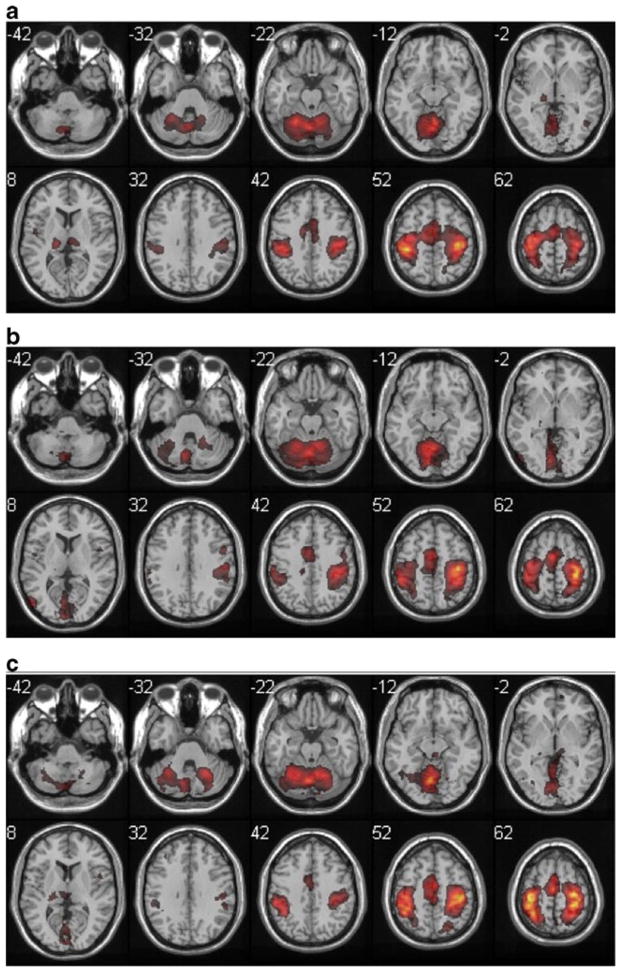
Fig. 2.
Group analysis of bimanual finger-tapping task-related activations, with color scale representing Z [1.5 to 18]. a adult, b aged, c stroke. Z coordinates in MNI space are shown next to each slice, with right hemisphere on the right for this and all other figures. Activity was very similar across the three groups, except for a more posterior extent of the frontoparietal cluster in the stroke group

