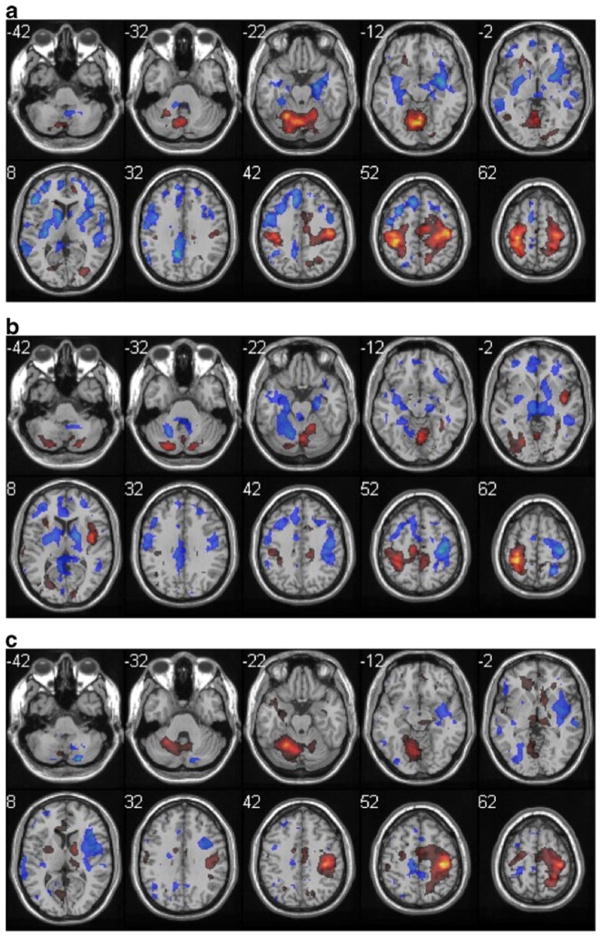
Fig. 5.
Task differences in adult group, displayed as in Fig. 1, except that color scale represents negative Z scores from −7.5 to −1.5 in cold colors and positive differences from 1.5 to 14.5 in hot colors. a buttoning > bimanual. b zipping > bimanual. c buttoning > zipping

