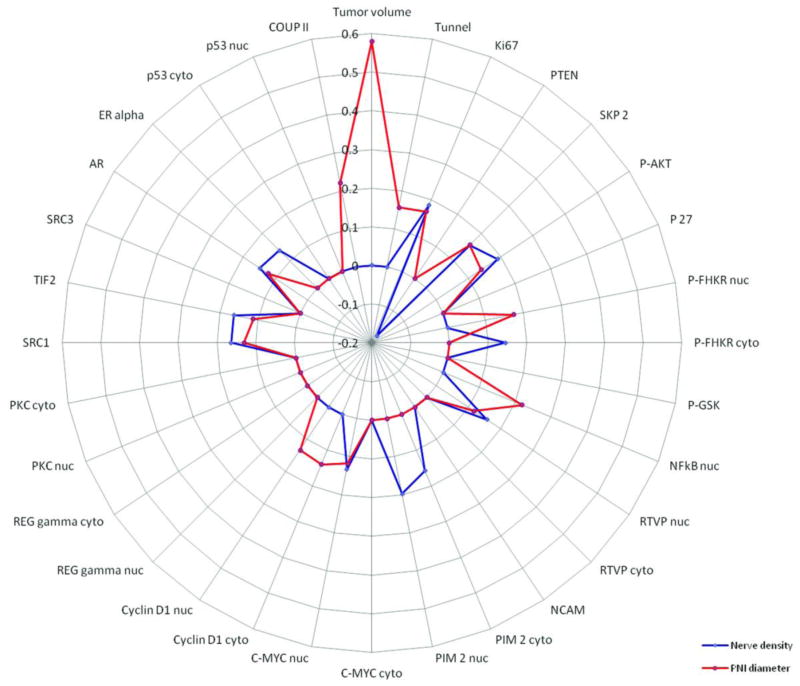
Figure 2.
Visualization of the correlation between biomarkers previously stained in this cohort and nerve density as measured by PGP 9.5 immunoexpression (blue line) and PNI diameter (red line). Absence of correlation is plotted as a dot on the 0 (zero) line, positive correlations are plotted outwards, while negative correlations are plotted inwards, towards the center. The correlation coefficients are labeled at approximately 12:00 o’clock.

