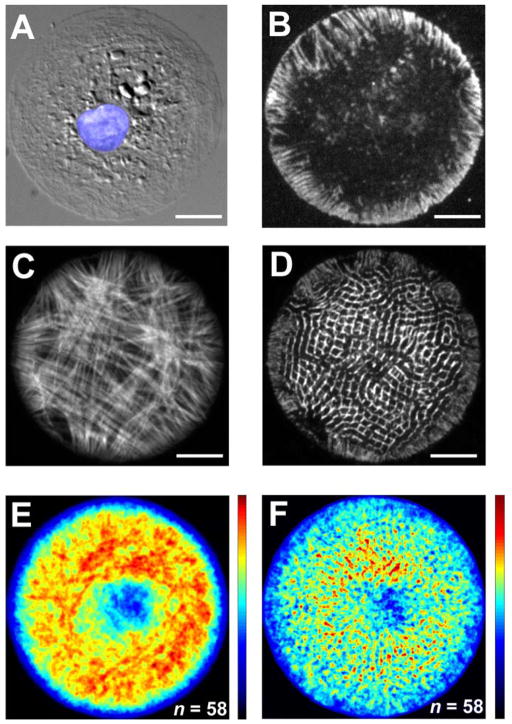
Figure 2.
(A) A DIC image of a cultured myocyte on a microcontact printed circular ECM island (radius: 26 μm) with the nucleus colored in blue. (B) FAs linking the myocyte to the ECM are highlighted by stained vinculin. The associated F-actin (C) and sarcomeric α-actinin (D) in a representative circular myocyte shows the absence of a preferential axis of organization. The resultant sarcomere organization for an ensemble of circular myocytes is illustrated via averaged images of F-actin (E) and sarcomeric α-actinin (F) distributions from fixed and stained myocytes. Scale bars: 10 μm.

