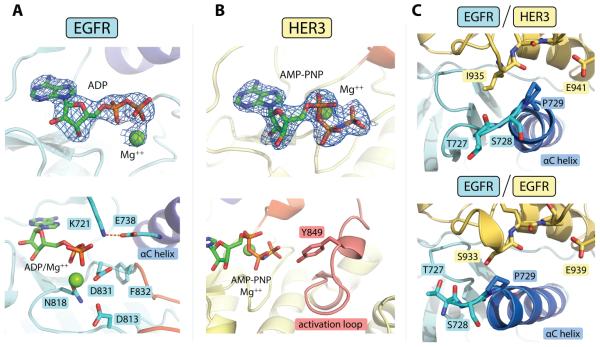
Figure 2.
Detailed structural features of the EGFR/HER3 heterodimer. (A) Top: electron density for the ADP/Mg++ complex observed in the EGFR active site (at 3.0 σ above the mean value). The difference electron density maps shown in all panels were calculated using a model of the protein at a refinement stage before the inclusion of the nucleotide. Bottom: detailed view of the EGFR active site, showing an optimal catalytic center. (B) Top: Electron density for the AMP-PNP/Mg++ complex bound to the HER3 nucleotide-binding site (3.0 σ). Bottom: Stable conformation of the HER3 activation loop enables visualization of Tyr849 in one of the HER3 subunits in the asymmetric unit. (C) Conformational variability observed at the N-terminus of the αC helix in the EGFR/HER3 (top) and EGFR/EGFR (bottom, PDB ID: 2GS6) asymmetric dimers. In all panels, carbon atoms contained within the αC helix are blue and activation loop sequences are red.

