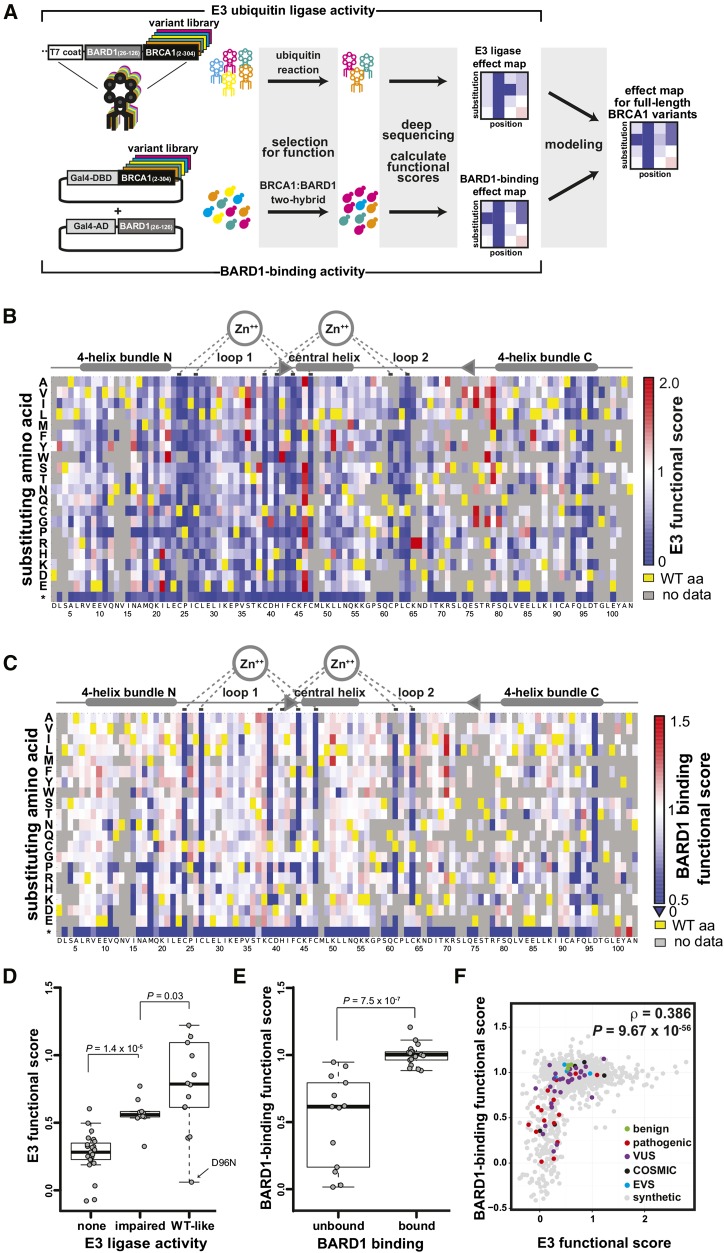
Figure 1.
(A) Scheme for leveraging scores from parallelized assays for BRCA1 RING function into predictions for the function of the full-length BRCA1 protein in homology-directed DNA repair. (B-F) Scoring the E3 ligase and BARD1-binding activities of BRCA1 RING domain variants. (B) A sequence-function map of the effect of missense mutations in the BRCA1 RING domain on E3 ligase function. The functional score for each variant is the slope of the fit curve, normalized by setting stop codons to a score of 0 and the wild-type to a score of 1. Each position in BRCA1(2-103) is arranged along the x-axes, structural features of the RING domain are diagrammed above. The amino acid substitutions, grouped by side-chain properties, are on the y-axes. The E3 ligase scores range from improved activity versus wild-type (red), equivalent to wild-type (white), to less than wild-type (blue). Yellow represents the wild-type residue and gray missing or low confidence data. (C) A sequence-function map of the effect of missense mutations in the BRCA1 RING domain on BARD1-RING binding. Coloring as in panel B. (D) Comparison of the variant scores from the deep mutational scan for E3 ligase activity versus literature-reported E3 ligase activities for the same BRCA1 variants (Brzovic et al., 2003; Morris et al., 2006). The Wilcoxon rank sum test (WRST) was used to test for significant differences between the categories. The biggest outlier in the wild type-like category, D96N, not only performed poorly as an E3 ligase score but also failed to bind to BARD1 and to support homology-directed repair in cells (Table S2). (E) Comparison of BARD1-binding scores from the two-hybrid experiment versus literature-reported BARD1 binding by the same BRCA1 variants (Brzovic et al., 2003; Ransburgh et al., 2010). The WRST was used to test for significant differences between categories. (F) The relationship between the quality-filtered E3 ligase functional scores and the BARD1-binding scores. Colors indicate the clinical classification or database of origin for each variant.

