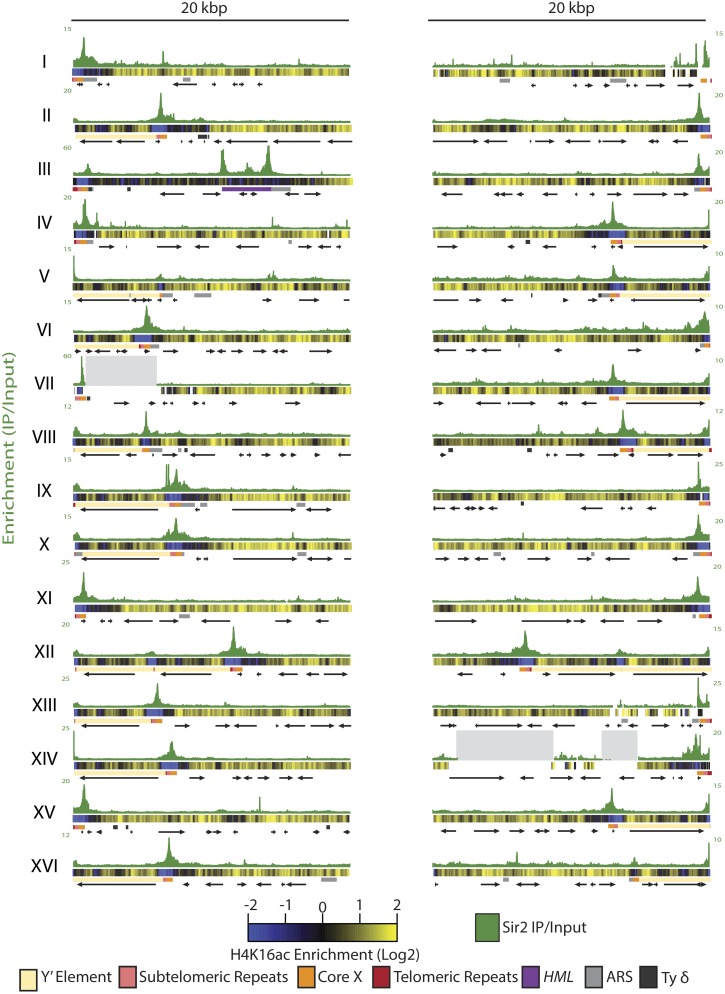
Figure 2.
H4K16 exhibited hypoacetylation in regions greater than Sir2 protein association. Sir2 enrichment is shown for each telomere as the IP/input for that base-pair position. Below the Sir2 enrichment track for each telomere is a heat map representing the log2 of H4K16 IP/input. Blue represents regions of hypoacetylation where the IP value is below the input value, and yellow represents IP/input values greater than 1, which indicate acetylated regions. Salient features for each telomere are shown: telomeric repeats as red boxes, subtelomeric repeats as pink boxes, the core X as orange boxes, and HML as a dark-purple rectangle. Origins of replication and Ty δ elements are marked in light gray and dark gray, respectively. ORFs are represented by black arrows. All features were mapped as annotated in the SGD.

