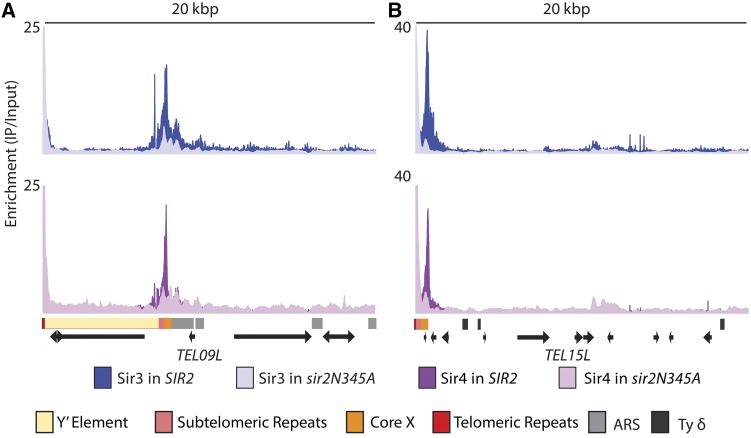
Figure 3.
Sir3 and Sir4 association in strains lacking Sir2 catalytic activity. ChIP-Seq reads of Myc-tagged Sir3 and Sir4 in a strain expressing a catalytically inactive point mutant SIR2 allele, SIR2N345A, were analyzed at the telomeres. A representative X-Y′ telomere is shown in A, and a representative X-only telomere is shown in B. The upper panel shows Sir3 association in the WT SIR2 strain (dark blue) and the mutant sir2N345A background (light blue). The lower panel shows Sir4 association in the WT SIR2 strain (dark purple) and the mutant sir2N345A background (light purple). Salient features for each telomere are as in Figure 2.

