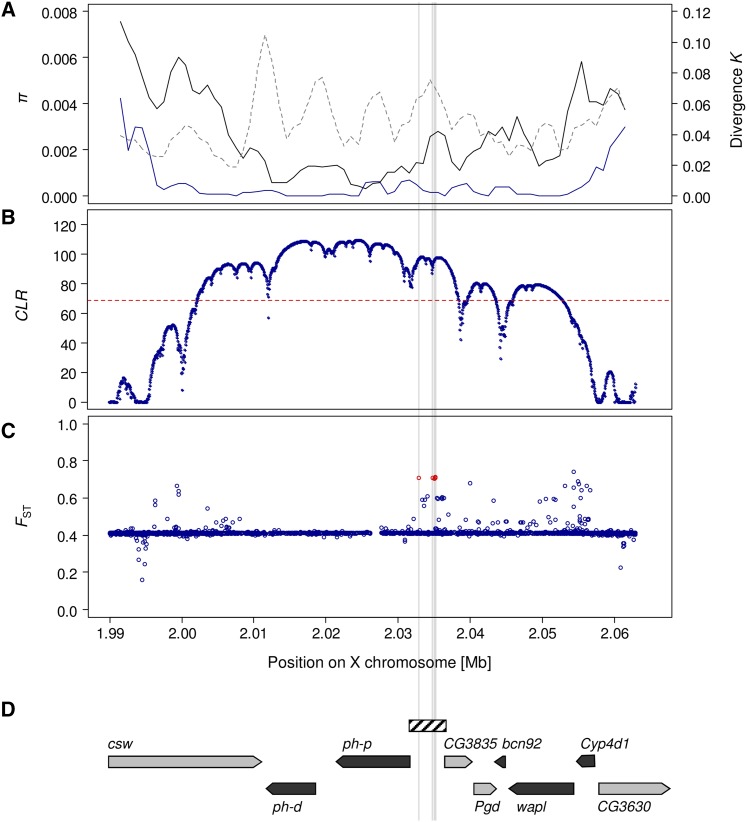
Figure 1.
Evidence of positive selection in the Drosophila polyhomeotic (ph) genomic region. (A) Nucleotide variability (π) in European population samples from The Netherlands (blue line) and an African sample from Zambia (black line), as well as divergence (K) to D. simulans (dashed line), is shown in a sliding window across the region (window size = 3000 bp, step size = 1000 bp). (B) Composite-likelihood-ratio (CLR) analysis of a selective sweep using the site-frequency-based test statistic of SweeD (Pavlidis et al. 2013) for a European sample consisting of the Dutch and the French lines. The significance threshold of the test statistic is given by the dashed line. (C) BayeScan FST coefficients (Foll and Gaggiotti 2008) averaged over seven population samples from Europe and Africa (see Materials and Methods). BayeScan results based on a 300-kb window surrounding the ph locus (of which 73 kb are shown here) reveal a total of six outlier SNPs (FDR = 0.05) within the selective sweep region that was identified by the SweeD test. One of these is already segregating in the African samples, in contrast to the other five outlier SNPs that are located in the ph-p/CG3835 intergenic region. The latter are highlighted in red and by gray lines across panels. (D) The positions of the genes contained within the region. The arrowheads indicate the direction of transcription. The hatched box corresponds to the portion used for reporter gene analysis.

